Filled result graphs
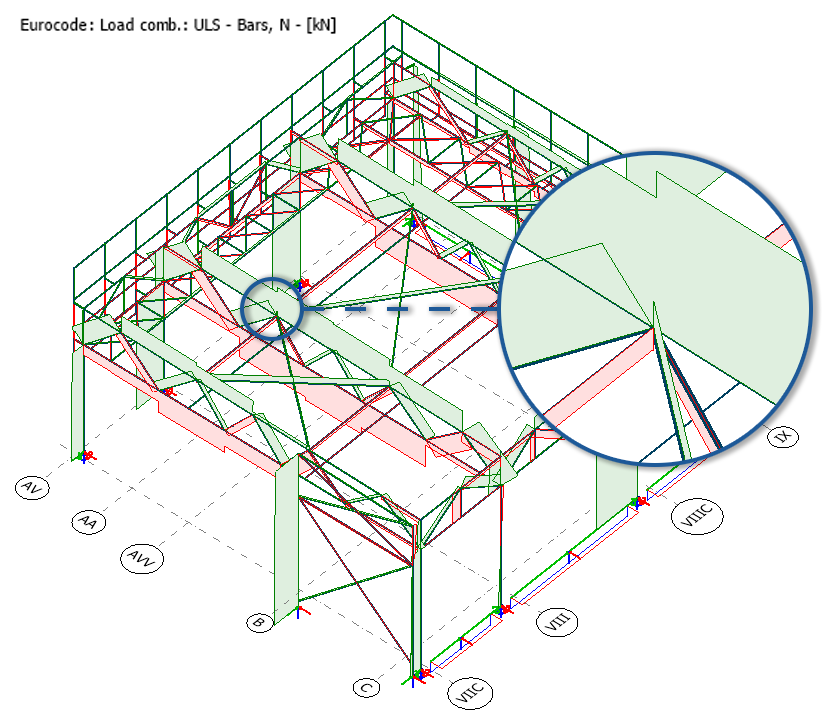
FEM-Design 25 introduces a new display option that allows graph-based results to be visualised as filled, solid graphs in 3D space.
By filling result graphs with colour, their relative magnitude and spatial position become much easier to interpret, even in partially overlapping views. This visualisation mode improves the readability of results both on screen and in documentation outputs.
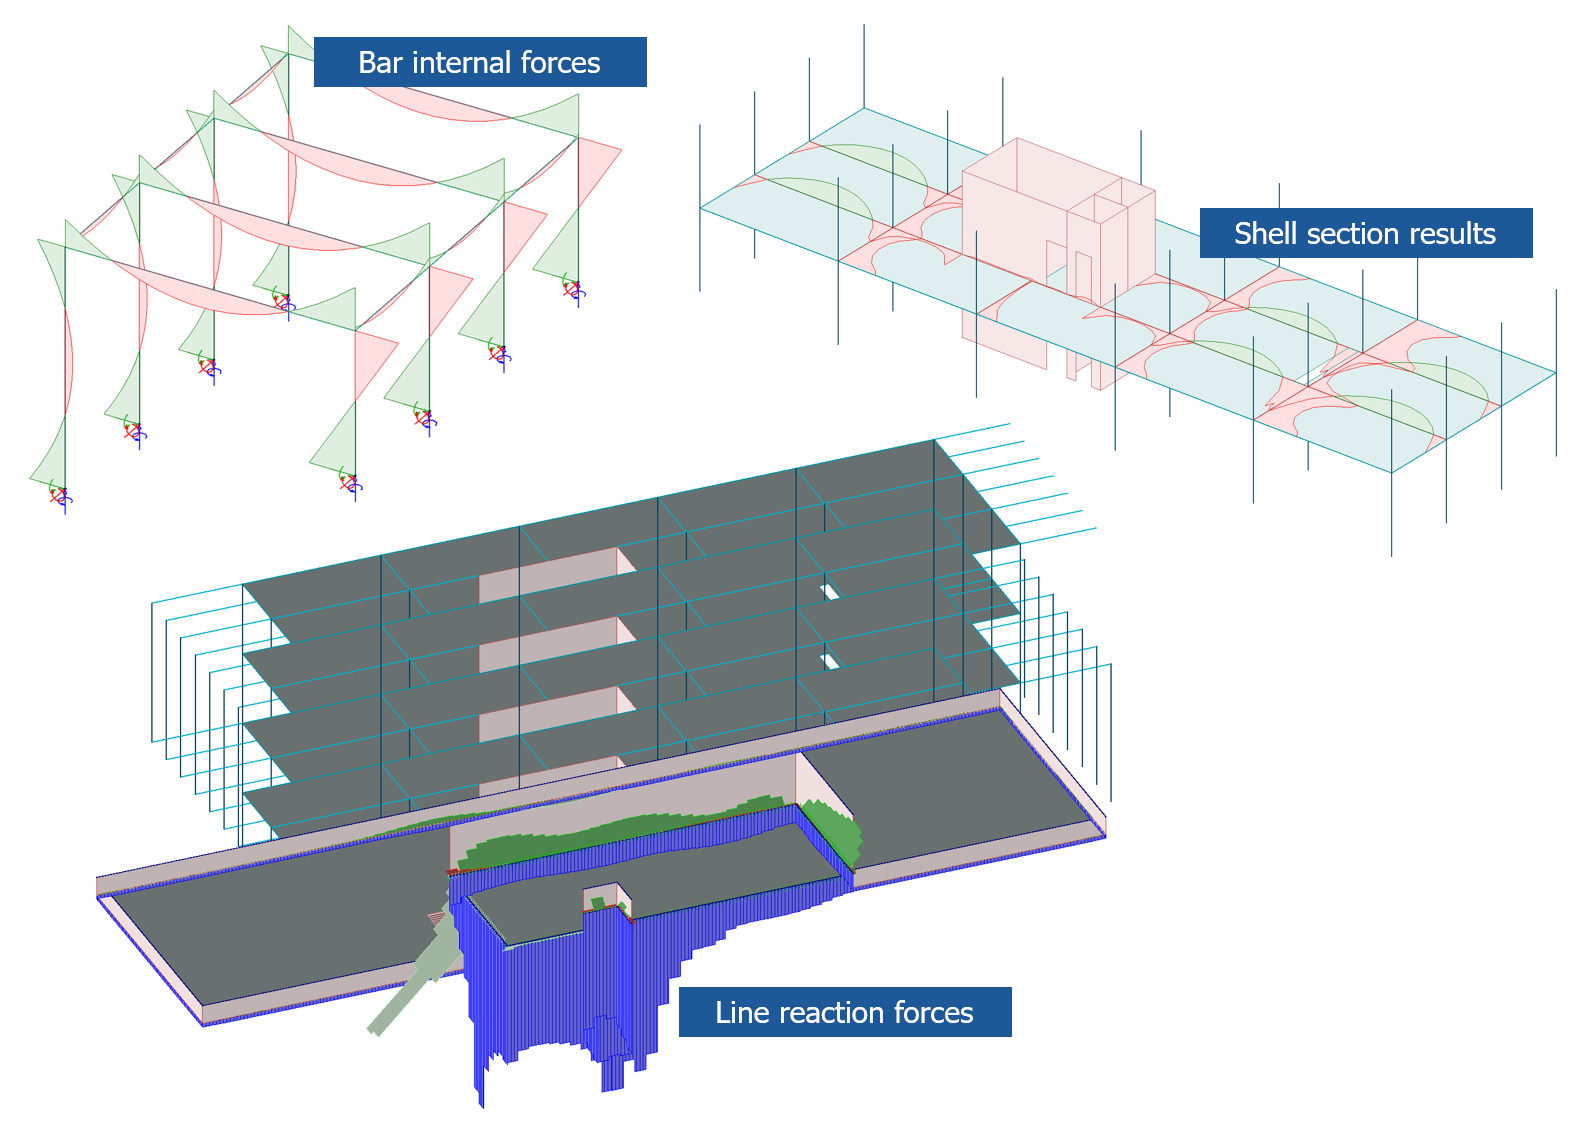
The solid-filled graph display is available for the following result types:
- internal force diagrams of bar elements
- section results evaluated on shell elements
- line-based reaction force components and resultants
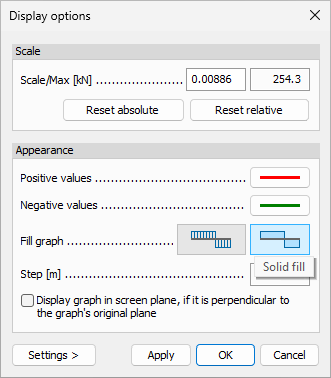
Solid graph filling and colour assignment, including differentiation between positive and negative values, can be configured in the Display options.