New result
New result
Use New result to select which type of analysis result you want to display. The interface that opens depends on whether the Quick tools panel is currently visible.
![]()
Both interfaces provide access to the same result categories and display options. The Quick tools version is intended for faster switching during result review, while the Display result dialogue provides a standalone selector when the panel is hidden.
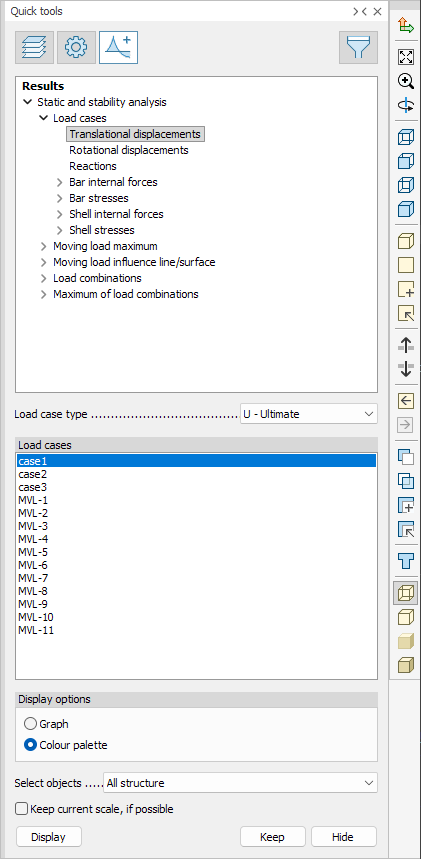
When Quick tools panel is open
The Results tab in the Quick tools panel opens automatically and shows the available result categories.
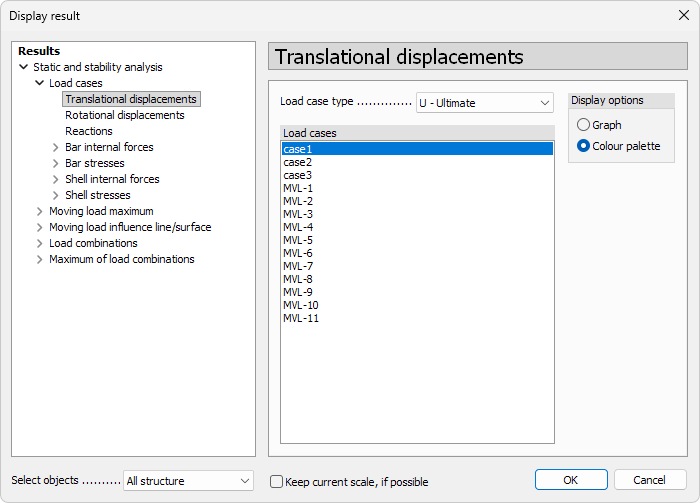
When Quick tools panel is closed
A separate Display result dialogue window appears, listing all available result types.
For detailed descriptions of all available results, see:
Analysis ➔ Analysis results ➔ List of analysis results
Options and settings
The New result interface contains several areas that allow you to select, refine and display analysis results. The available options depend on whether the tool is used via Quick tools or via the separate New result dialogue, but the structure and logic are the same.
Result list
The first area shows a list of all available results, grouped into categories based on what was selected in the Calculate dialogue.
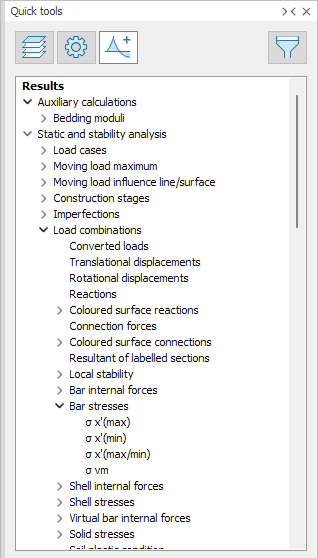
You must select a result from this list to access its additional options and settings. Only results relevant to the performed analyses are shown.
For more info on the result grouping, see:
Analysis ➔ Analysis results ➔ Analysis results grouping
Result options
The result options area allows you to refine how the selected result is evaluated and displayed. The availability of individual options depends on the selected result type.

Possible result options include:
- Calculation – drop-down menu with available analysis types: 1st order analysis, U, Ua, Us; 1st order analysis, Sq; 1st order analysis, Sf; 1st order analysis, Sc; 2nd order analysis, U, Ua, Us; 2nd order analysis, Sq; 2nd order analysis, Sf; 2nd order analysis, Sc; Stability analysis; Dynamic analysis
- Combination – list of load combinations used in the analysis
- Construction stages – list of all construction stages included in the analysis
- Effective masses – table with modal analysis shapes and corresponding masses, times, frequencies and phases. This table is informational and may contain different columns depending on the result
- Imperfection shape table – table showing calculated imperfection shapes together with critical parameter and amplitude
- Load case type – drop-down menu with: U – Ultimate; Sq – Quasi-permanent; Sf – Frequent; Sc – Characteristic
- Load cases – list of load cases
- Load combination type – drop-down menu with: U – Ultimate; Ua – Accidental; Us – Seismic; Sq – Quasi-permanent; Sf – Frequent; Sc – Characteristic
- Moving load – list or drop-down menu of all moving loads in the model
- Position – list of moving load positions
- Result type – drop-down menu with: Overall maximum; Transient response; Steady state maximum; Steady state 1. harmonic; Steady state 2. harmonic; Steady state 3. harmonic; Steady state 4. harmonic
- Seismic shape – table with seismic shapes and their corresponding equivalent forces
- Self excitation regions – list of all excitation regions in the model
- Show positive only – checkbox to display only shapes with a positive critical factor in imperfection or stability shape tables
- Simultaneous – list of additional force or stress components that are shown at the location of the minimum or maximum value of the primary component
- Stability shape table – table showing calculated stability shapes with: Critical parameter; eH (probability of horizontal stability loss); eV (probability of vertical stability loss); rZ (probability of rotational stability loss)
- Storey – table with storeys used in the fundamental frequency analysis, showing frequency and mass for each storey
- Time – drop-down menu with all time steps from time history or periodic excitation analyses
- Velocity step – drop-down menu with all speed steps defined in the model
- Vibration shapes – table with vibration shapes and their corresponding frequencies, periods and modal masses
For more info on when each option is available, see:
Analysis ➔ Analysis results ➔ List of analysis results
Display options
The Display options area defines how the result is visualised.

Depending on the selected result, the display can be fixed and unchangeable or selectable from the following types:
- Graph
- Contour lines
- Colour palette
- Section
Only display types supported by the selected result are available.
For more info on different display results, see:
Analysis ➔ Analysis results ➔ Display options for analysis results
or for how to control the appearance and behaviour, see:
User interface ➔ Tab menus ➔ Analysis ➔ Panel Manage results ➔ Display options
Action area
The action area contains commands for displaying and managing results. Not all actions are available for every result type.

Available actions include:
- Select objects – drop-down menu with: All structure; Selection; and a list of all storeys in the model. Use this menu to control which structural elements the results are displayed for
- Keep current scale, if possible – checkbox that preserves the current display scale when switching results
- Display – button to show the selected result on screen. You can also double-click the result to display it
- Keep – stores the currently displayed result in the stored result list
- Hide – hides the displayed result without deleting it from the stored list
For more info on keeping of results, see:
User interface ➔ Tab menus ➔ Analysis Panel ➔ Manage results ➔ Select result